
Building an AI Ops Assistant for Infrastructure Monitoring
Dashboards tell you that something is wrong. An AI Ops assistant for infrastructure monitoring can tell you what is probably wrong, why, and what to do about it — in plain language, at 3 a.m., before you’ve had coffee.
This is a technical blueprint for SREs and platform engineers who want to build that assistant pragmatically: starting with read-only analysis, earning trust incrementally, and treating “give the AI write access to production” with the suspicion it deserves.
Moving Beyond Dashboards: LLM Infrastructure Observability Automation
Traditional observability stacks are excellent at collection and visualization, and mediocre at synthesis. When an incident hits, a human still has to correlate a latency graph, a burst of error logs, a deploy event, and a half-remembered incident from four months ago.
LLM infrastructure observability automation targets exactly that synthesis gap. LLMs are well suited to it because the raw material of incident triage is mostly unstructured text: log lines, alert payloads, deploy annotations, runbooks, and postmortems.
Practical capabilities to build first:
- Alert enrichment. When an alert fires, the assistant pulls recent logs, related metrics, and recent deploys, then attaches a plain-language summary: “Error rate on
checkout-apirose after the 14:02 deploy; logs show connection pool exhaustion to Postgres.” - Log summarization. Instead of a human scanning thousands of lines, the assistant surfaces the anomalous pattern and the first occurrence.
- Runbook retrieval. Using retrieval over your runbooks and past postmortems, the assistant attaches the most relevant procedure to each incident.
Notice what’s not on this list: taking action. Every capability above is read-only. That’s deliberate, and it’s where every team should start. For a concrete build-along of this first stage, see our companion guide to an AI ops assistant suggesting fixes.
Designing an AI Agent for Infra Alerting and Suggestions
An AI agent for infra alerting and suggestions has a simple core loop:
- Trigger: an alert fires (webhook from your alerting system) or a scheduled scan runs.
- Gather context: the agent queries metrics, fetches recent logs, lists recent deploys/changes, and retrieves matching runbook sections.
- Analyze: the LLM receives the gathered context in a structured prompt and produces a diagnosis hypothesis plus suggested next steps.
- Deliver: the output lands where engineers already are — the alert channel, the incident ticket, or the PR that caused it.
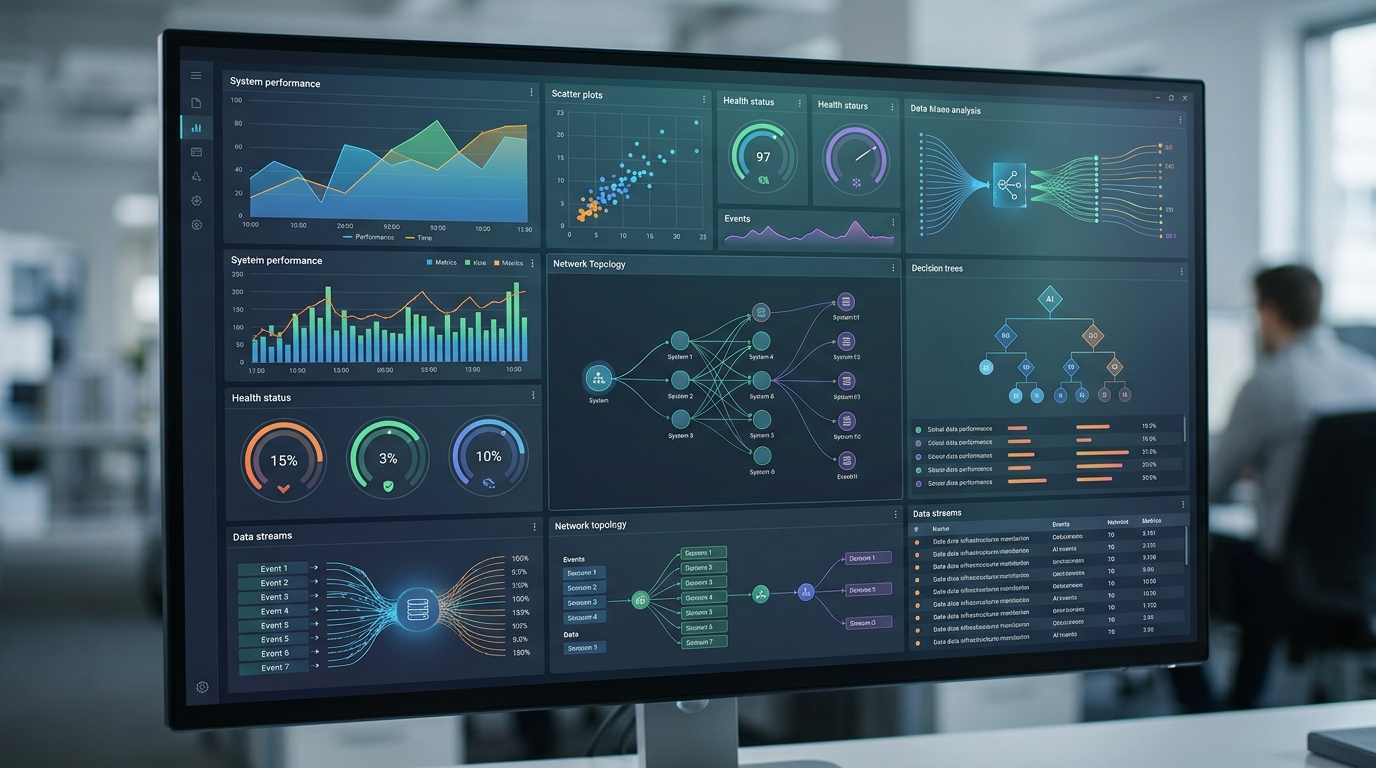
A dashboard interface for an AI Ops assistant, presenting synthesized infrastructure alerts and suggested actions.
Design principles that separate a useful assistant from a noisy toy:
- Structure the prompt like an incident report. Give the model labeled sections (ALERT, RECENT_DEPLOYS, LOG_EXCERPT, RELATED_RUNBOOK) rather than a blob of text. Structured input produces structured, checkable reasoning.
- Demand cited evidence. Require the model to quote the specific log lines or metrics behind each hypothesis. An uncited claim is a hallucination candidate; make them easy to spot.
- Force ranked hypotheses, not verdicts. “Most likely: connection pool exhaustion (evidence: X). Also possible: DB failover (evidence: Y).” Engineers trust ranked reasoning; they distrust false confidence.
- Include an “insufficient data” path. The assistant must be able to say “I can’t determine the cause from available context” — and that answer should be common early on.
- Keep the human loop tight. Add 👍/👎 feedback on every suggestion. This gives you a precision metric and tells you when prompts or retrieval need tuning.
LLM Ops Monitoring in Production: What to Track
The assistant is itself production infrastructure, so LLM ops monitoring in production applies to it recursively: you must monitor the monitor.
Latency, Token Usage, and Cost Tracking
Track per invocation:
- End-to-end latency, split into context-gathering time vs. LLM inference time. An assistant that takes five minutes to comment on a page is worthless during an incident.
- Token usage per request, input and output. Context-heavy prompts (logs are verbose) can balloon costs quietly. Set alerts on token consumption anomalies just as you would on any resource.
- Cost per incident analyzed. This is the number your budget conversation needs. If you’re on self-hosted models, translate to GPU-time per analysis instead.
- Failure and timeout rates of the LLM calls themselves, with a defined degradation mode: when the assistant is down, alerts flow exactly as they did before it existed.
Integrating System Logs with Your AI Ops Assistant
Feeding logs to an LLM needs engineering discipline:
- Filter before you prompt. Send error/warn-level excerpts and anomalous windows, not raw firehoses. A retrieval or heuristic pre-filter (spike detection, new-pattern detection) keeps context windows sane and costs bounded.
- Redact aggressively. Logs contain tokens, emails, and internal hostnames. Run redaction before any log line reaches an external API — or keep the whole loop on a self-hosted model if policy demands it.
- Preserve timestamps and source labels in the excerpt so the model can reason about ordering and correlate across services.
- Log what the assistant saw. Store the exact prompt and response for every invocation. When the assistant gives a bad suggestion, you need to reconstruct why. This is the same discipline you’d use to monitor and log AI agent activity anywhere else in your stack.
Toward an Infrastructure Self-Healing AI Agent
An infrastructure self-healing AI agent — one that acts, not just suggests — is the endpoint of a trust ladder, not a starting point. Climb it in stages:
- Stage 1 — Read-only analyst. Suggestions only. Measure precision via engineer feedback for weeks, not days.
- Stage 2 — Prepared actions. The agent drafts the remediation (the exact
kubectl rollout undocommand, the config revert PR) but a human executes it. This removes toil while keeping judgment human. - Stage 3 — Approval-gated execution. The agent proposes an action from a pre-approved allowlist; a human taps “approve” in chat; the agent executes and reports back.
- Stage 4 — Autonomous execution, narrow scope. Only for actions that are proven safe, reversible, idempotent, and boring: restarting a crashlooped pod, clearing a full temp disk, scaling a stateless service within preset bounds. Everything else stays gated.
Most teams should live at stages 2–3 for a long time. The pattern of using an agent as a structured error handler — rather than a free-roaming operator — is covered in depth in our guide to self-healing automation with AI.
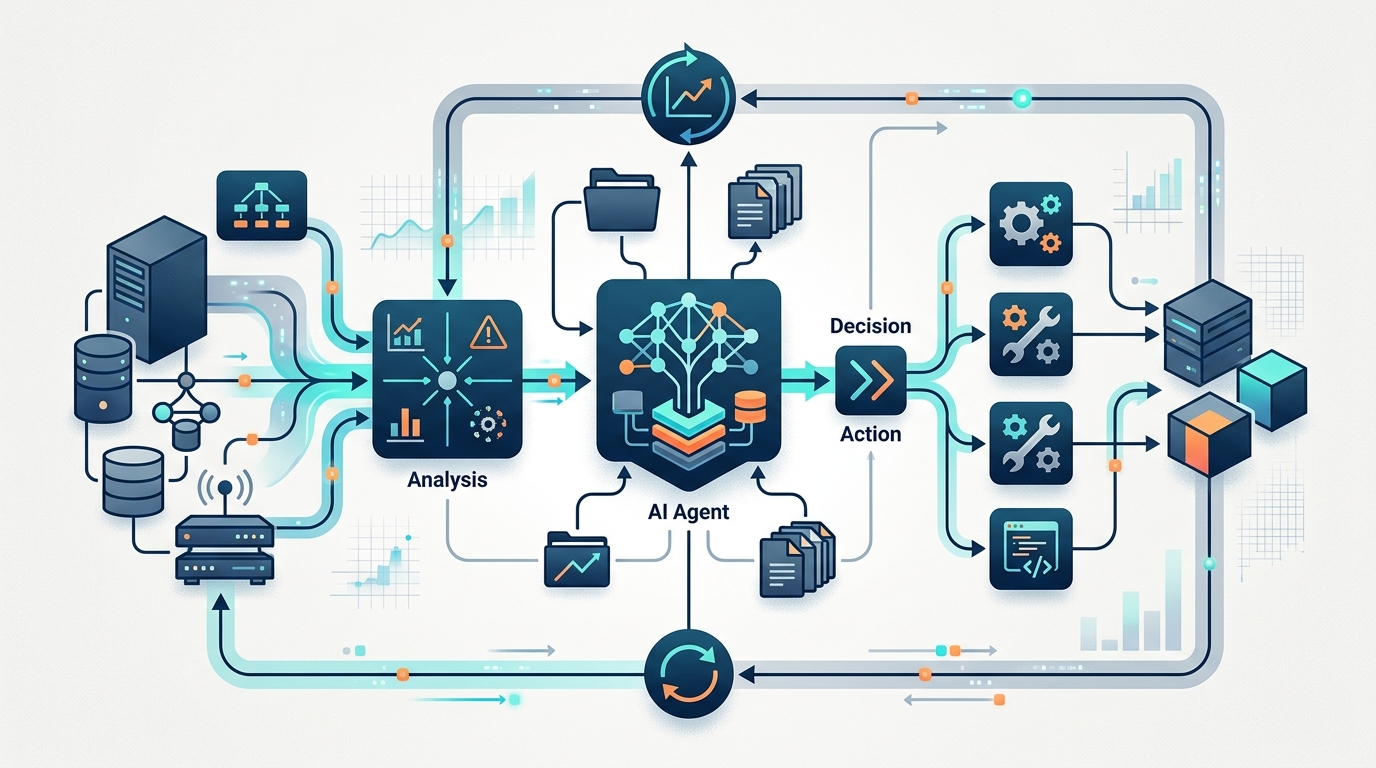
Conceptual architecture of an infrastructure self-healing AI agent, illustrating its components and operational flow in a production setting.
Setting Safeguards: Ensuring Ops AI Agents Don’t Break Things
Be blunt about the risk: an LLM with write access to production can misread context and execute a destructive action with full confidence. Safeguards are not optional hardening — they are the core design.
- Allowlist actions, never generate them. The agent selects from a fixed menu of parameterized, reviewed operations. It never composes arbitrary shell commands for execution.
- Least-privilege credentials. The agent’s service account can do exactly the allowlisted operations in exactly the permitted namespaces — enforced by IAM/RBAC, not by the prompt.
- Blast-radius caps and rate limits. One remediation per service per time window; hard caps on scale factors; no cross-environment actions. A malfunctioning agent should be annoying, not catastrophic.
- Immutable audit trail. Every observation, suggestion, approval, and action is logged to append-only storage. Postmortems must be able to replay the agent’s exact inputs and outputs.
- A kill switch humans actually know about. One command or chat action disables all agent execution instantly. Drill it, the way you drill failovers.
- Never let the agent modify its own guardrails. Prompts, allowlists, and permissions change only through human-reviewed pull requests.
Start read-only. Earn trust with measured precision. Expand scope one boring, reversible action at a time. That’s the whole playbook.
FAQ
What does an AI Ops assistant actually do that dashboards don’t?
It synthesizes. Dashboards display signals; the assistant correlates alerts, logs, deploys, and runbooks into a plain-language diagnosis with cited evidence and suggested next steps — the work a human on-call engineer does manually during triage.
Should an AI agent have write access to production infrastructure?
Not initially, and never broadly. Start read-only, then progress through prepared actions and approval-gated execution. Reserve autonomous execution for a small allowlist of reversible, low-blast-radius operations enforced by least-privilege credentials.
How do I prevent the assistant from hallucinating incident causes?
Require cited evidence (quoted log lines, specific metrics) for every hypothesis, force ranked possibilities instead of single verdicts, give it an explicit “insufficient data” option, and track suggestion precision with engineer feedback.
Can I build this with a self-hosted LLM instead of a cloud API?
Yes — and if your logs contain sensitive data you can’t redact reliably, you should. The architecture is identical; only the inference endpoint changes. Budget for GPU capacity and slightly weaker model quality in exchange for full data control.
What should I monitor about the AI Ops assistant itself?
Latency (context-gathering vs. inference), token usage and cost per analysis, LLM call failure rates, and suggestion precision from human feedback. Log every prompt and response so bad suggestions can be reconstructed and debugged.